
Oceanographer: Pacific Ocean blob is gone, but will return
Note to Reader:
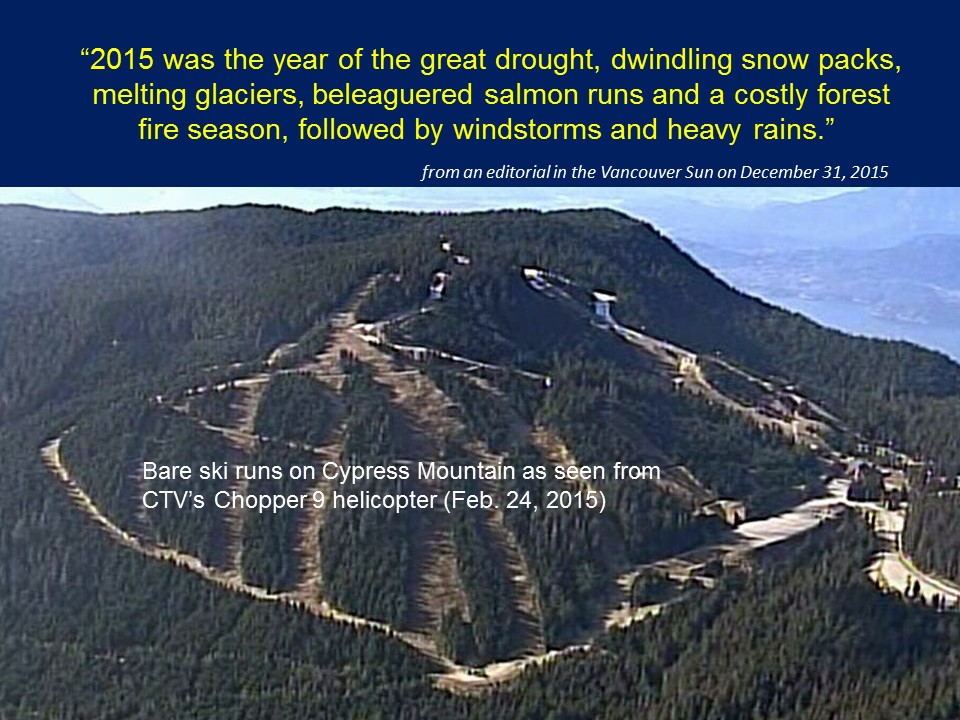
In April 2016, the Vancouver Sun newspaper published an article (on its page 2) about the blob — a warm ocean area roughly the size of the continental United States. Written by veteran reporter Kent Spencer, and headlined Oceanographer: Pacific Ocean blob is gone, but will return, the article connects the dots to the 2015  Drought and incorporates insights provided by Kim Stephens, Executive Director, Partnership for Water Sustainability in British Columbia.
The starting point for the Vancouver Sun article was a research paper by Hillary Scannell et al, published in March 2016 issue of Geophysical Research Letters, an open source publication.
Frequency of Marine Heat Waves
Extreme and large-scale warming events in the ocean have been dubbed marine heatwaves, and these have been documented in both the Northern and Southern Hemispheres. The paper by Hillary Scannell examines the intensity, duration, and frequency of positive sea surface temperature anomalies in the North Atlantic and North Pacific Oceans over the period 1950–2014.
 “We find that marine heatwaves have a probability of 20% in the western North Pacific, 24% in the eastern North Pacific, and 20% in the North Atlantic. These statistics imply that marine heatwaves on par with the 2012 northwest Atlantic event should naturally occur once every 5 years or less. However, the intensity and duration of marine heatwaves are also modulated by modes of intrinsic climate variability that oscillate on interannual-to-multidecadal time scales,” concluded Hillary Scannell and her co-authors.
Is there a connection to drought in British Columbia?
Kent Spencer interviewed Hillary Scannell to obtain her insights about a correlation between “the blob” and British Columbia’s changing climate. He reported that the study found that temperatures had never been as high as in 2013-2014; and quoted Hillary Scannell as saying that B.C. is “right on the frontline”.
The end of winter (on March 21, 2016) had been followed less than a month later by a summer-like heat wave that resulted in record temperatures. Hence, Kent Spencer also asked Kim Stephens for his perspective: “Do you believe there is a connection between  the blob and BC’s changing climate.”
Kim Stephens responded that he really had no informed basis for drawing any conclusions. All he could do was reflect on his past experience as a water resource practitioner for four-plus decades to comment on possible short-term scenarios for the south coast of British Columbia.
The interview focus was on a comparison of precipitation patterns in the first three months of 2015 versus 2016, and the published storage drawdown graphs for Metro Vancouver’s three water supply lakes. A look back to 1992 also provides a relevant frame of reference for informed comment.
“I maintain a rain gauge on my property,” stated Kim Stephens. “Looking at the data, the monthly rainfall totals for January, February and March in 2016 are very close to the monthly numbers for 2015. And now April 2016 is a dry month just as it was in 2015. The difference this year is that cooler winter temperatures at the higher elevations mean there is a snowpack whereas in 2015 there was little snowpack by February.”
Water Supply Scenarios for 2016?
“At the beginning of February, seasonal forecasts from Environment Canada had indicated a high likelihood of above-normal temperatures across British Columbia over the February to April period, and an increased chance of warmer than normal temperatures through the extended forecast period into the summer months,” noted Kim Stephens. “This reminds me of what happened in 1992 when we had an extreme heat wave in the May-June period that resulted in early and rapid snowmelt…and the third drought in six summers in the Metro Vancouver region.”
 This observation led Kent Spencer to ask about possible best and worst case scenarios for water supply in 2016.
“Historically, a key rule-of-thumb for managing water supply in the Metro Vancouver is that the region’s water supply lakes are full as of July 1st. When that is the case, the total available volume should be sufficient to sustain the region through a drought that lasts up to four months – that is, July through October. It is years in which the storage levels have been drawn down on July 1st, such as happened in 1992 and 2015, that have necessitated Stage 3 restrictions on outdoor water use,” explained Kim Stephens.
“Snow pack is just one of the important elements that determine whether or not extreme conditions will emerge. Weather, through melt season and into the summer, is also a key driver on whether or not low stream flows will occur.”
“The region is now in a wait-and-see situation. Stage 1 water restrictions take effect on May 15 – that is a key first. And with the 2015 experience still fresh in the minds of most folks, that does make it easier for regional officials to be proactive and take action sooner rather than later,” concluded Kim Stephens.
To Learn More:
Download a copy of Frequency of Marine Heat Waves in the North Atlantic and North Pacific since 1950, the article by Hilary Scannell et al. This is an open access article under the terms of the Creative Commons Attribution-NonCommercial-NoDerivs License.
And read Context for the 2015 Drought: What Happens on the Land Matters!, a story posted elsewhere on the Water-Centric Planning community-of-interest.
